Dashboard
The Dashboard is the landing page for quick operational awareness.
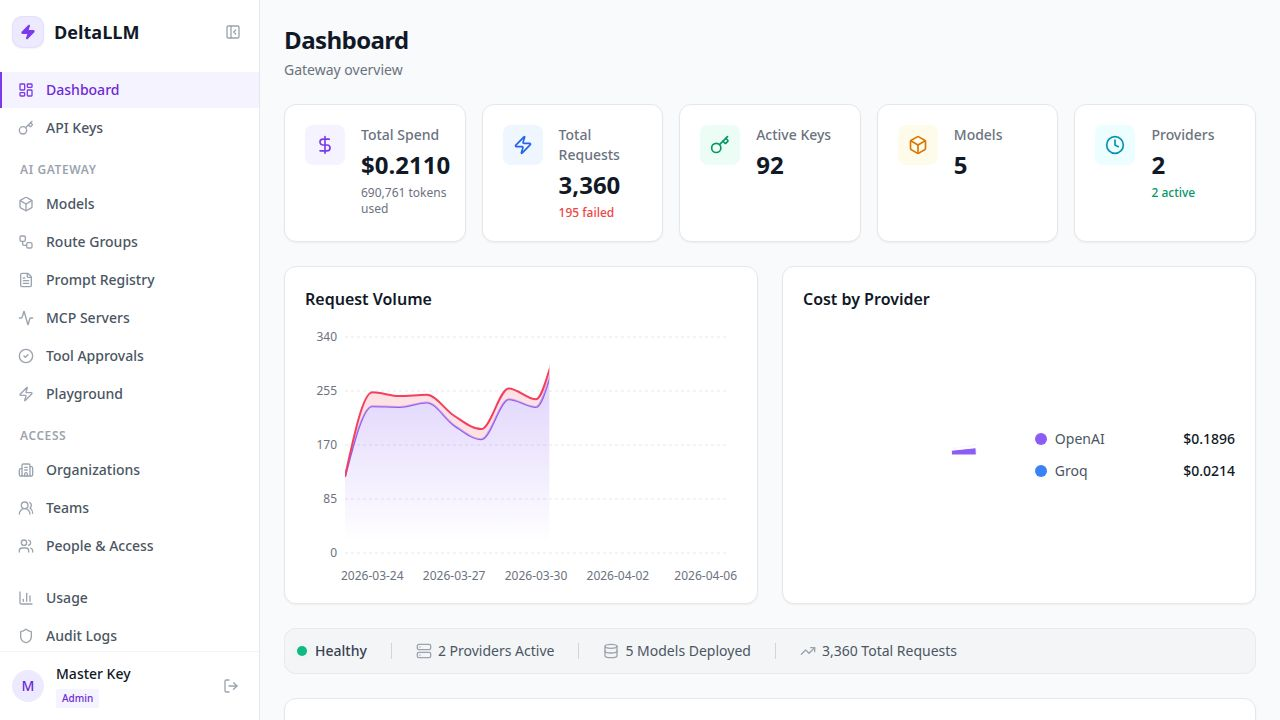
What it summarizes
- Total spend
- Total requests
- Total processed tokens
- Active model count
Main widgets
- Top cards show the current high-level totals
- Daily spend trend helps spot spikes or regressions
- Usage breakdowns show which models or groups are carrying traffic
When to use it
Start here when you need a health and spend snapshot before drilling into models, route groups, usage, or audit history.